
| s(q) for 11Li(p,p’) at 68 MeV/u |
|
|
|
|
|
|
|
|
|
|
|
|
|
|
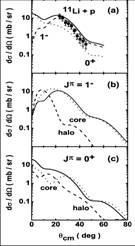
| z | (a) Comparison
of the theoretical |
||||||||||||
| calculations
with experimental |
|||||||||||||
| data |
|||||||||||||
| z | Solid, dashed
and dotted lines |
||||||||||||
| show the total,
monopole and |
|||||||||||||
| dipole angular
distributions, |
|||||||||||||
| respectively. |
|||||||||||||
| z | In (b) and (c),
solid lines show |
||||||||||||
| angular
distributions for the |
|||||||||||||
| monopole and
dipole excitations, |
|||||||||||||
| respectively. |
|||||||||||||
| z | Dashed and
dotted lines are |
||||||||||||
| contributions
from the halo |
|||||||||||||
| neutrons and
the core nucleons. |
|||||||||||||